


Recent Projects
We conduct applied and methodological research in several areas of GIScience, including geovisualization, interactive web-mapping, map design, GIS modeling, and remote sensing.
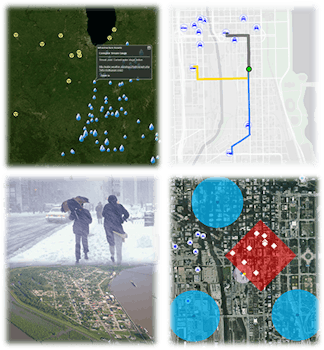
Web-Mapping for Emergency Management
Web-mapping tools have become increasingly popular in emergency management contexts for hazard planning, mitigation, response, and recovery purposes. The goal of this project was to design and develop a web-based mapping system for use by emergency managers in Illinois. In conjunction with the Illinois Emergency Management Agency (IEMA), a prototype system was developed utilizing a user-centered design approach that solicited input and feedback from emergency responders from across the state. The project is funded by IEMA through the U.S. Department of Homeland Security.
The emerald ash borer (EAB) is an invasive pest from China that has destroyed thousands of ash trees in the United States in recent years. The objective of this research was to test the feasibility of utilizing color infrared (CIR) imagery in conjunction with extensive field data to assess EAB infestation. The project is funded by the Illinois Department of Agriculture through the U.S. Department of Agriculture.
Emerald Ash Borer
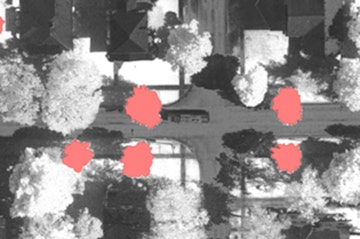
The emerald ash borer (EAB) is an invasive pest from China that has destroyed thousands of ash trees in the United States in recent years. The objective of this research was to test the feasibility of utilizing color infrared (CIR) imagery in conjunction with extensive field data to assess EAB infestation. The project is funded by the Illinois Department of Agriculture through the U.S. Department of Agriculture.
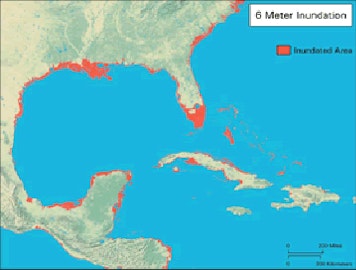
Sea Level Rise
The objective of this research is to develop GIS methods for modeling and visualizing global sea level rise due to climate change. The project was initiated through the Center for Remote Sensing of Ice Sheets (CReSIS) at the University of Kansas and Haskell Indian Nations University. Ongoing work focuses on the development of improved methods for effectively visualizing sea level rise at local, regional, and global scales. See the sea level rise project website for project results to date.
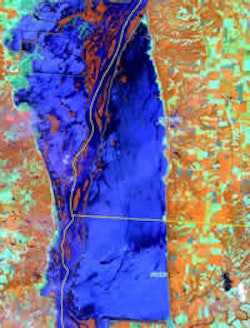
Midwestern Flooding 2008
During the month of June, Midwestern U.S. received large amounts of rainfall as one storm after another passed over the region. Many areas of Indiana, Illinois, Iowa, and Wisconsin received record amounts of precipitation and high streamflows that were accompanied by widespread flooding along the Mississippi River and its tributaries. GEOMAP is working with the U.S. and Illinois State Geological Surveys to process and analyze imagery collected by various satellites during the month of June and July. This work will help define the geographic extent of the flood that will be critical in the assessment of its impact. For more information visit the Illinois State Geological Survey.
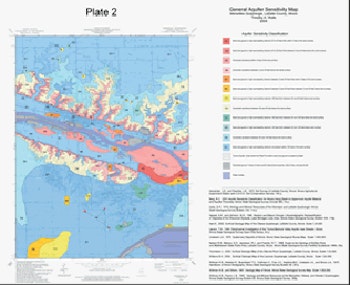
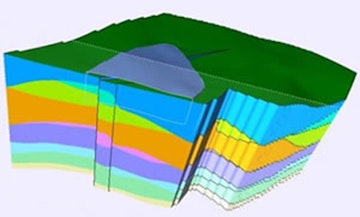
Geologic Mapping
In collaboration with geologists at the Illinois State Geological Survey Survey, Dr. David Malone and his students create state-of-the-art, three-dimensional (3D) maps that characterize a particular region’s geology to depths of several hundred feet. The maps allow developers and planners to identify resources and hazards that exist at and below the surface, such as freshwater aquifers susceptible to contamination sites, soils that magnify earthquake risks, and terrain subject to erosion, flooding, or subsidence. These high-resolution maps are targeted where they are most needed, in urban/suburban areas and regions with known environmental and homeland security risks. Detailed geological maps can save local, state, and federal governments, as well as the private sector, 100s of millions of dollars annually.
For example, a rigorous economic assessment of the only completed statewide mapping of this type was conducted for Kentucky. Using very conservative assumptions, there was a return of $25 to $39 for each government dollar invested in geological mapping. Furthermore, the Kentucky maps, completed originally to boost the mineral and energy industries, at a cost of about $90M, have been used primarily to address water supply and protection issues, growth, development, and environmental problems, and mitigation of a variety of natural hazards.